There is a myriad of different ways to monitor the health of a crop, from NDVI scanning, plant counts, GAI, or rootling about with a good old fashioned trowel, but more growers are moving towards the use of testing plant material.
Such methods are used to fine tune crop nutrition programmes, which can in hand reduce inputs, improve crop quality and potentially reduce foliar disease pathogens and other issues such as lodging.
There are a few key tests which can help growers and agronomist determine if they have got the balance right.
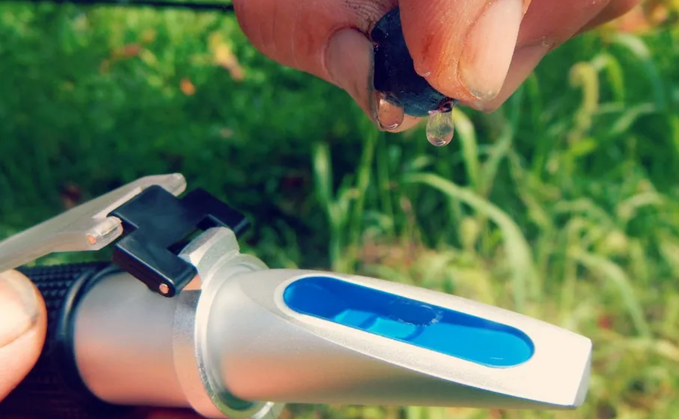
Brix meters, or refractometers can be bought relatively cheaply online, and act as a crude tool to gauge overall plant health, immunity and quality. However, there are many variables that can influence readings, so to get the most out of brix testing, a fine eye for detail and note recording is essential, explains international soil expert, Joel Williams.
"Brix testing is not a perfect tool, in fact it's a bit of a blunt tool but it's better than nothing. It can be used to compared relative treatments, good and bad areas and compare development over time."

Brix is a measure of photosynthesis, including complex sugars, carbohydrates, amino acids and proteins, which make up a plant's ‘defence chemicals'.
Testing is carried out by crushing the leaf of the plant, for example using a garlic crush, and dropping sap onto the refractometer to take a reading.
"The more sugars, complex carbohydrates and so on that we have in that plant sap, the higher the brix reading will be," explains Mr Williams. "You are chasing a high brix reading with a blurry line - this is the best identification of plant health. For example, a reading of 4 with a crisp line is low and means you're at a foundational level of plant photosynthesis. The plant is only really producing smaller, simpler sugars. It takes additional nutrients to take that building block and convert it into more complex plant compounds which support the second stage of plant metabolism. They are the compounds that present this more blurry line."
This can give growers an idea of how well the plant is photosynthesising and how optimised its nutrient status is to produce defence chemicals that protect it against insect or disease attack.
Data
Growers can also use chlorophyll metres and sap pH to build a bigger body of data. However, to get full diagnostics of plant nutrient status, Mr Williams suggests full tissue or sap analysis.
Tim Ashley, independent agronomist and agroecologist, based in Shropshire, initially uses two metrics to assess plant health - sap pH and brix testing.
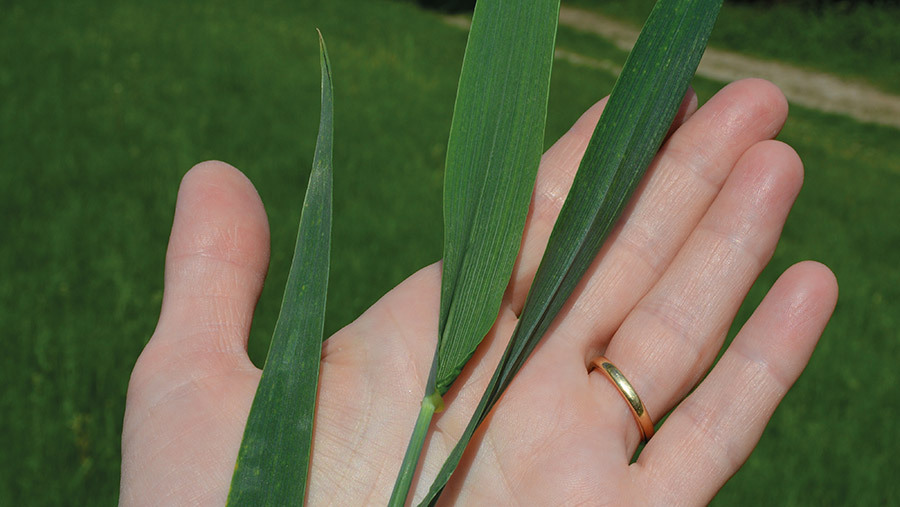
Sap pH is carried out in the field by squeezing the sap from leaves with the same garlic crush on a relatively inexpensive digital pH meter, to give generalised information on the status of the plant.
Mr Ashley explains: "We know the ideal pH of a plant is about 6.4. Anything less than 6, we can surmise there might be a cation problem such as calcium, magnesium or potassium. You would then clarify that with a sap or tissue test. Likewise, if the pH was reading high at 7 or above, it would be an anion problem such as nitrogen, phosphates or sulphur shortages. If that fitted in with management, e.g. the farmer had not put on any sulphur then you could put two and two together, or confirm it with a tissue sample."
Combining the two tests can be insightful, for example, a low Brix and high pH would indicate incomplete nitrate metabolism, which may be in excess relative to phosphates, sulphates or magnesium. In general, it is showing poor soil biology function, Mr Ashley explains.
There is no need to start field testing until photosynthesis in the plant has fully kicked in in late March-April, and doing it before this can give skewed results.
"If we test too early the plant is going to be deficient in everything, so there is the temptation to throw everything at it. The focus should be on the soil biology and rooting at this stage. Once crops start to move and respond to nitrogen, that's when we start looking at brix, sap pH and full sap analysis if we feel it's relevant."
Once testing has started, it should be repeated every two-three weeks.
Mr Ashley says: "At T0, I tend to take a broad spectrum approach to nutrition based on experience and field history. If it's a ‘growy' season, at T1 I do sap analysis to correct deficiencies to try to balance out any extremes. The sap test can also give you an understanding of whether a particular product has worked or not - does it actually get metabolised into the plant or just sit on the leaf surface?"
Two weeks later another test is undertaken to see if the T1 application worked and if any more issues need addressing at T2.
For oilseed rape, two, possibly three tests are carried out during the season, and only once for most spring crops, says Mr Ashley.
Representative sample
To get a representative sample of varying crops across the farm, he suggests breaking crops into blocks.
"First and second wheat tend to be managed differently, plus feed wheat and milling wheat we treat differently, so I would do separate tests for these. I might also test different areas within crops based on things like soil type, or good and bad areas."
The time of day the sample is taken is also very important.
"We want to take sap first thing in the morning. During the day the plant is photosynthesising so most of its energy is going into that and collecting nutrients. During the night, it's metabolising those nutrients into secondary metabolites. One of the key things we're looking for is if it has used all the nitrogen it pulled up through its roots during the day. I want sap results to be very low in ammonium and nitrate - then I know it's working efficiently from a nitrogen point of view. If nitrogen levels are still high first thing in the morning, there is something wrong with how the plant is using other nutrients to process soluble nitrogen into proteins."
For the same reason, brix testing should be carried out where there is likely to be maximum photosynthesis, such as midday.
Mr Ashley says: "If I do a brix test and it's particularly high first thing in the morning, it's a clue the crop isn't metabolising its sugars during the night. If you test on an overcast, drizzly day crops won't be photosynthesising particularly efficiently so you'll get a low result. If it's a nice sunny day and it's still low, you've got potential issues that need further investigation."
When it comes to sap and tissue testing, there are fundamental differences between these two tests, he explains.
"Tissue testing is like taking some fat tissue or muscle from a person, whereas sap analysis is like taking blood - you are able to see what is being metabolised. Tissue testing will measure that but also include minerals and compounds that it's storing; for example, plants need iron in the reduced form but will absorb and store iron in the unavailable oxidised form. It will potentially show high or adequate in a tissue test but deficient in the sap test. ��Elements that are not particularly good from a tissue point of view but are good in sap analysis are boron, copper, iron and potentially manganese."
Snapshot
Sap analysis offers a fairly instant snapshot of what is going on in a crop at that point in time to allow growers and agronomists to make quick decisions in determining what the crop is short of.
"Tissue testing will eventually get there but if you look at some of the comparisons between tissue and sap, tissue analysis lags behind by 20-30 days. Sap will give you the most accurate and instant understanding of how the crop is metabolising minerals at that point in time. Whereas tissue analysis might confirm your observations, in which case it's a useful and relatively cheap management tool. There are pros and cons to each."
But what benefits can carrying out these tests actually bring?
"Such tests will help growers determine a crop's susceptibility to pest or disease attack," says Mr Williams. "There's a fairly significant body of evidence and studies that look into [nutritional impact on plant defence]. Not all of these studies were successful at managing insects or disease with nutrition, but in many instances nutrition can indeed support the immune processes and be one tool in the toolbox of an integrated strategy.
"Key disease-fighting nutrients include calcium, silicon and boron for cell strength - the more of those in the cell walls, the more robust the plant, making it more difficult for pests and pathogens to penetrate."
Manganese, copper and boron are important for the ‘skin' of the plant, while internal systemic compounds like silicone, manganese and copper all have a role as immune inducers.
However, the nutrient normally under the most scrutiny is nitrogen.
"There is a view that too much nitrogen although increases yield, induces greater disease pressure," says Mr Williams. "That is valid but there's more nuance to that discussion and it is more about having an imbalance of nitrogen - there is too much nitrogen in relation to the other minerals that support nitrogen metabolism."
Problems with metabolising nitrogen arise when there are deficiencies of other minerals such as molybdenum, sulphur and iron, which support a plant's conversion of nitrogen into ammonium.
"This emphasises the importance of monitoring and managing plant nutrition. One benefit of sap analysis is that you can test both the young and old leaves. That really helps us tap into nutrient mobility throughout the plant. For example, potassium is very mobile, so if younger leaves have adequate potassium, but older leaves are much lower in potassium and bordering on deficiency, the plant has taken it from older leaves and sent it to new growth areas that are more photosynthetically active. As the potassium departs those older leaves to go to the new leaves, we're inducing a potassium deficiency in the older leaves, which is often the place where we see disease starting.
"Equally calcium is a highly immobile nutrient so doesn't move from the older leaves to new growth areas quite so easily. If calcium in older leaves was at an adequate level, but is marginal in the younger leaves, this is signalling to us it was okay, but now we have an immediate potential issue on the horizon."
While these tools are useful and offer growers useful insight, Mr Ashley urges growers not to overlook using all the tools in the box.
"Don't just rely on lab analysis. If you want to reduce inputs, use all of your senses - does the crop look stressed? Does the soil smell healthy? Take a spade, especially during establishment. Look at soil structure, and rooting habits and assess the soil biology, they are the key to efficient crop nutrition. Some are a bit crude, but they can give you instant information to give you something to focus your attention to. The foundations are also important from soil testing every three-five years and making notes of anything low or excessively high."
��
Sap testing in brief
- A SAP analysis will give a snapshot of plant uptake of nutrients and nutrient deficiencies, excesses or imbalances
- The first leaf samples (around 500g of tissue) should be taken at the start of the season as photosynthetic activity/rapid growth in the plant takes off
- Sample early in the morning
- Both old and new leaves can be sent for sampling
- Results should come back within three days so any corrective action can be taken
- Subsequent samples should be taken every two to four weeks throughout the season
Brix testing in brief
- Brix testing can be carried out in the field using affordable, handheld devices bought online
- It is a measure of the sugar concentration in a plant
- It often acts as a preliminary test before sending off plants for sap or tissue testing
- It should be carried out when the plant is at peak photosynthetic activity e.g. the sunniest time of the day
- Results can be heavily influenced by the environment/weather which should be taken into account when analysing results
- The higher the reading, the better the plant is photosynthesising
In the field: Fife
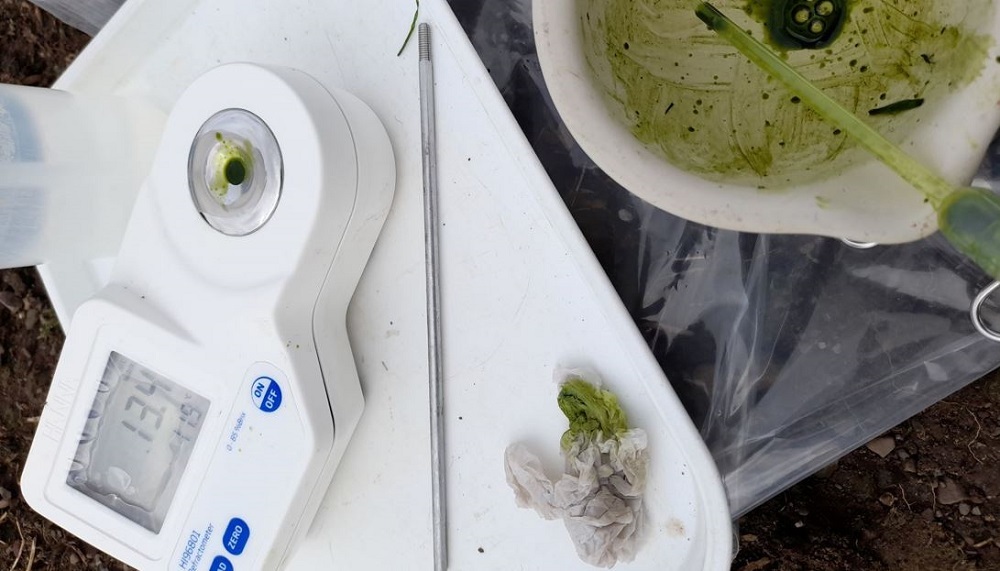
In Scotland, AHDB's Strategic Cereal Farm near Fife is exploring whether adapting nutrient application timing based on plant health test results can produce a healthier wheat crop.
With many growers moving away from regimented fungicide applications to assessing a crop before application as part of an effective IPM strategy, the aim of the 2020-21 trial was to see if amending nutrient applications in response to testing the plant, resulted in a healthier crop than when conventional nutrient applications are made.
A field of Skyscraper was divided into three tramlines - Tramline 1: standard agronomy used SAC technical notes without fungicide to compare how nutrition alone affects plant health; Tramline 2: farm standard led by the farm's agronomist to see how adjusting nutrients affects crop health in comparison to farm standard; and tramline 3: nutrient adjusted whereby regular brix assessments were taken at the same time of day to use the tissue's sugar as an indication of photosynthetic rate and therefore give an impression of crop health. When brix readings fell below 10, a bulk tissue sample was sent for rapid analysis and within a week the trial steering group decided the inputs as a product of the results.
According to lab sap analysis, at GS23 there was low manganese, and good and excess other nutrients across each tramline. By contrast, at GS33 there was low calcium in each crop tramline, and low magnesium in the farm standard tramline. Overall, the nutrient adjusted tramline was closest to an optimal nutrient balance.��
Brix values from GS21 in mid-March towards ear emergence in mid-June overall showed no significant seasonal difference in brix values between tramlines. However, between tillering (mid-April) to stem extension (early-May), brix values were just significantly greater in tailored agronomy (21.3) compared to untreated (17.9) and standard agronomy (19.4).
When cost of production was assessed using FarmBench data, it was possible to estimate several efficiencies for each tramline. Overall, wheat yield was low, and the standard agronomy tramline resulted in a higher yield (7.7t/ha) compared to the untreated (5t/ha) and tailored (adjusted) agronomy (5.5t/ha) tramlines. However, in terms of efficiency, for yield per cost of nutrient input, or N offtake or estimated grain N use efficiency (NUE), the standard agronomy tramline was substantially higher than the untreated and tailored agronomy tramlines. When using crop protection costs only, the tailored agronomy had most yield-to-cost benefit, and for overall input costs, yield-to-cost benefit was comparable among each tramline.�� ��


